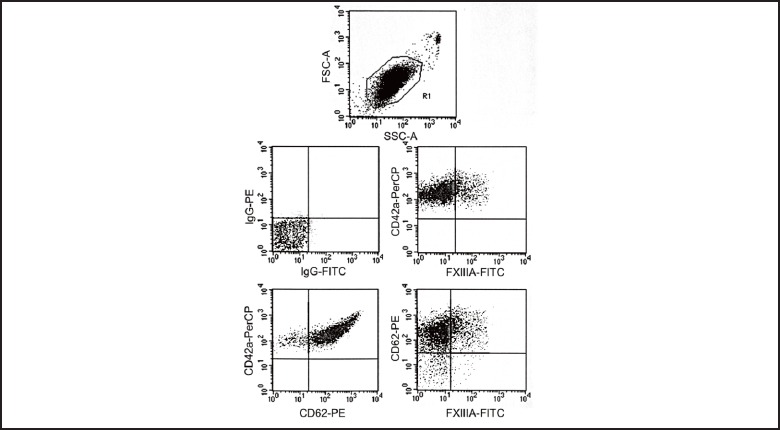
Figure 2.

Representative dots plot series on TRAP- activated (20 µM) platelets (R1) in a normal whole blood sample analyzed by flow cytometry in three-color labeling experiments with anti-FXIIIA-FITC, anti- CD62-PE and anti-CD42a-PerCP antibodies. FXIII-A showed a co-expression with CD62P (23%). CD62% was 94% due to full platelet activation.
