
Figure 2.
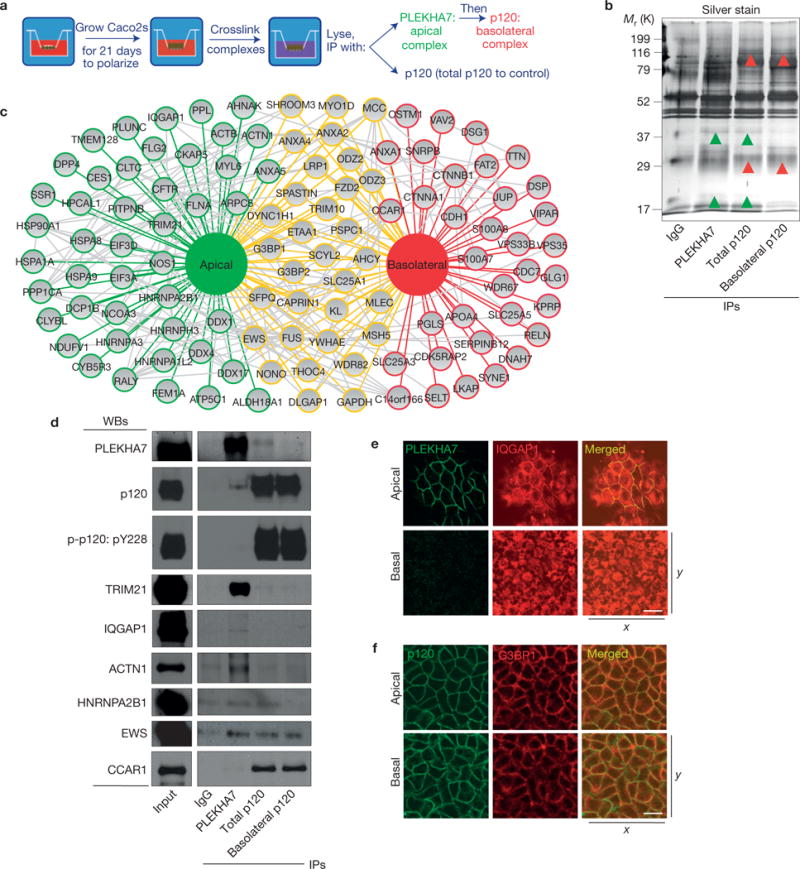
Biochemical separation of two distinct junctional complexes by proteomics. (a) Outline of the methodology to isolate the apical and basolateral complexes from polarized Caco2 cells. (b) SDS–polyacrylamide gel electrophoresis (SDS–PAGE) and silver stain of the isolated junctional fractions; green arrowheads indicate examples of apical-specific bands, whereas red arrowheads indicate basolateral-specific bands. (c) Schematic representation of the proteins identified after mass spectrometry of the isolated junctional fractions, identified in the apical (green outlines), the basolateral (red) or both fractions (yellow). Grey connections indicate known protein–protein interactions. See Supplementary Table 1 for the list of proteins and mass spectrometry peptide counts. (d) Western blot (WB) of the lysates from the separated fractions for PLEKHA7, p120 and markers identified in the apical (TRIM21, IQGAP1, ACTN1, HNRNPA2B1), the basolateral (CCAR1) and both fractions (EWS). The isolated fractions were also blotted for phosphorylated p120 Tyr 228 (p-p120: pY228), another basolateral marker (Fig. 1b). See Supplementary Fig. 8 for unprocessed blot scans. (e,f) Polarized Caco2 cells were stained and imaged as in Fig. 1 for PLEKHA7 and IQGAP1 (e) and for p120 and G3BP1 (f). All scale bars: 20 μm.