
Figure 6.
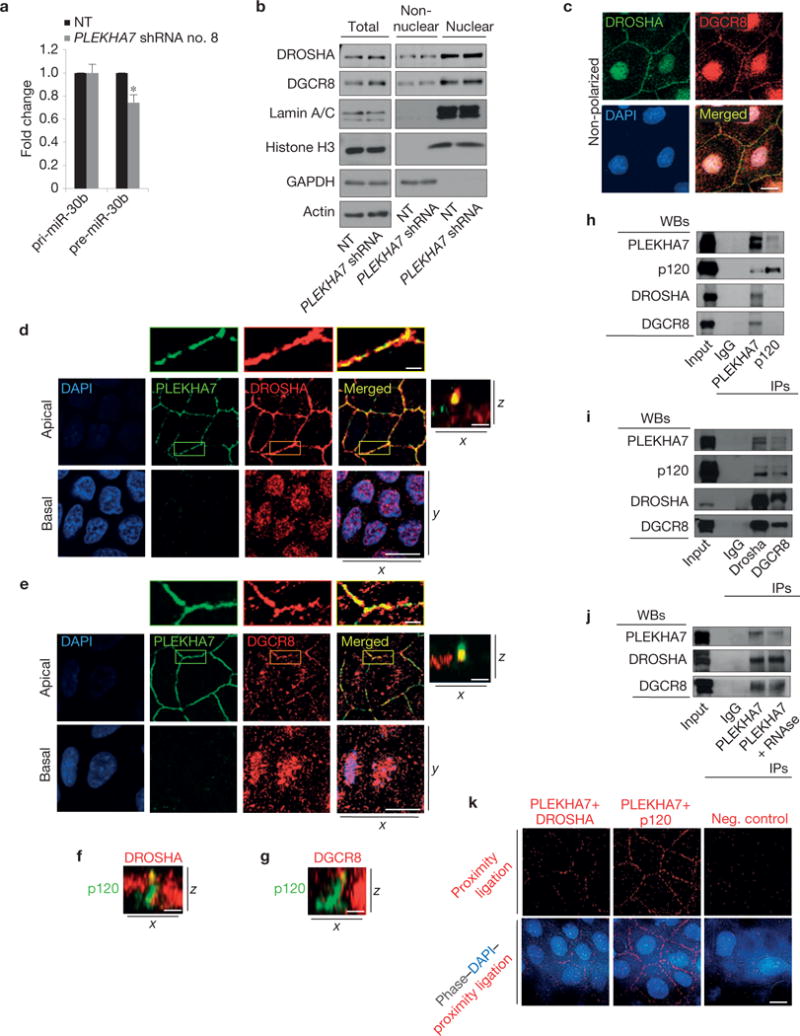
PLEKHA7 associates with DROSHA and DGCR8 at the ZA. (a) qRT–PCR analysis of pri-miR-30b and pre-miR-30b in Caco2 control (NT) or PLEKHA7 knockdown (PLEKHA7 shRNA) cells (mean ± s.d. from n = 3 independent experiments; *P = 0.02, Student’s two-tailed t -test). Source data are provided in Supplementary Table 2. (b) Western blot of either total cell lysates or of nuclear and non-nuclear lysates after subcellular fractionation of Caco2 NT or PLEKHA7 shRNA cells for the indicated markers. Lamin A/C and histone H3 are the nuclear and GAPDH the cytoplasmic markers; actin is the total loading control. (c) IF of non-polarized Caco2 cells, co-stained for DROSHA and DGCR8; 4,6-diamidino-2-phenylindole (DAPI) is the nuclear stain. (d,e) IF of polarized Caco2 cells co-stained for PLEKHA7 and DROSHA or DGCR8. Enlarged details in boxes are shown above the apical fields; a composite x–z merged image is shown at the side of the x–y image stack (antibodies used here: DROSHA, Abcam; DGCR8, Abcam; see also Supplementary Fig. 6b–e for a second set of antibodies used and Supplementary Table 3 for antibody details). DAPI is the nuclear stain. (f,g) Composite x–z images of polarized Caco2 cells co-stained by IF for p120 and DROSHA or DGCR8 (see Supplementary Fig. 6b,c, respectively, for x–y set of image stacks). (h,i) Western blots of PLEKHA7, p120, DROSHA and DGCR8 IPs for the markers shown. IgG is the negative IP control. (j) Western blot of PLEKHA7 IPs with and without RNAse treatment; IgG is the negative control. (k) Proximity ligation assay using PLEKHA7 and DROSHA antibodies, PLEKHA7 and p120 antibodies (assay positive control) or a p120 antibody only (assay negative control); the composite phase contrast–DAPI–proximity ligation images are also shown. Scale bars for x–y images, 20 μm; for x–z images, 5 μm; for enlarged parts of d and e, 3 μm. See Supplementary Fig. 8 for unprocessed blot scans of b,h–j.