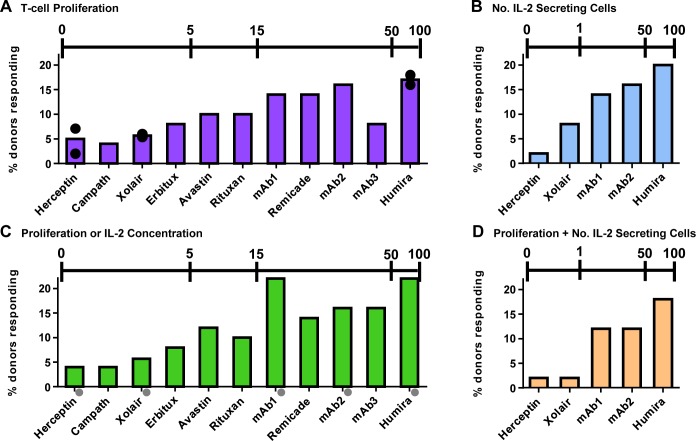
Fig 1. The response of CD4+ T-cells in the IVCIA assay agrees with the rate of clinical immunogenicity for biotherapeutic mAbs.
10 mAbs, with known rates of clinical immunogenicity, were evaluated in the IVCIA assay in a population of 50 healthy human donors over 5–8 days. mAb1 has not been tested in the clinic. Donors that responded by multiple readouts were evaluated for the most effective relative risk ranking. The percentage of donors that showed A) a positive T-cell proliferative response ([3H]-thymidine uptake) or B) an increase in the number (No.) of IL-2 secreting cells (Elispot) over the course of the entire study are displayed. Results were also combined to illustrate the percentage of donors that showed C) either a positive T-cell proliferation response or an increase in the concentration of IL-2 secreted (multiplex cytokine analysis) or D) a positive T-cell proliferation response and an increase in the number of IL-2 secreting cells are shown. Not all donors were tested for IL-2 for some samples (grey circles). A response was considered positive if the SI ≥ 2.0 (p<0.05) for proliferation or number of IL-2 secreting cells or the SI ≥ 1.9 for IL-2 concentration (above the background response). mAbs are ordered approximately within each graph from the lowest to the highest response in the IVCIA assay. The scale bars at the top of each graph show the highest incidence of immunogenicity reported for each mAb in Table 1. All rates are associated with diverse disease indications and assay testing platforms with variable sensitivity. Black circles represent duplicate experiments in different sets of 50 donors.

