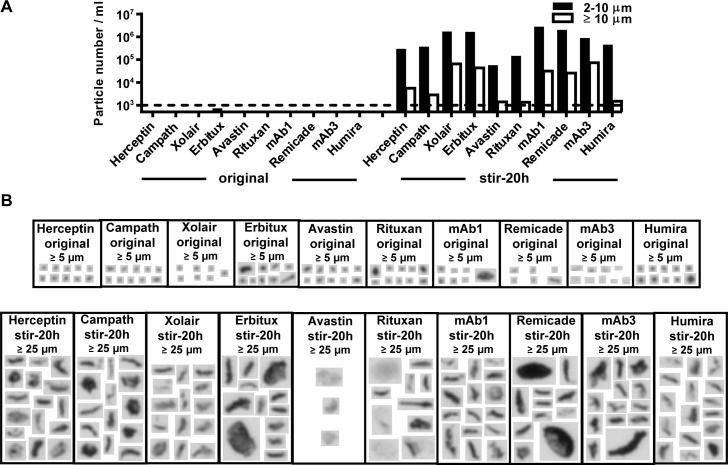
Fig 3. Particle counts, size distribution, and morphology of stirring induced aggregates of a broad array of antibodies.
10 mAbs (with known or predicted rates of clinical immunogenicity) were aggregated by stirring stress and then examined for their subvisible and visible aggregate content. A) Aggregates were quantitated by HIAC to determine the number and size range of particles present. Bar height represents the differential particle counts per ml in each size range (average of 3 runs). B) Aggregates images were captured on a Micro-flow Imaging System to evaluate the morphology of particles present. Representative images of the largest particles detected are shown. The size threshold indicates the lower size limit of the particles that were used for comparison. The aggregate content of the original mAbs (before stirring stress) is also shown and highlights that only a few small sized aggregates were detected.

