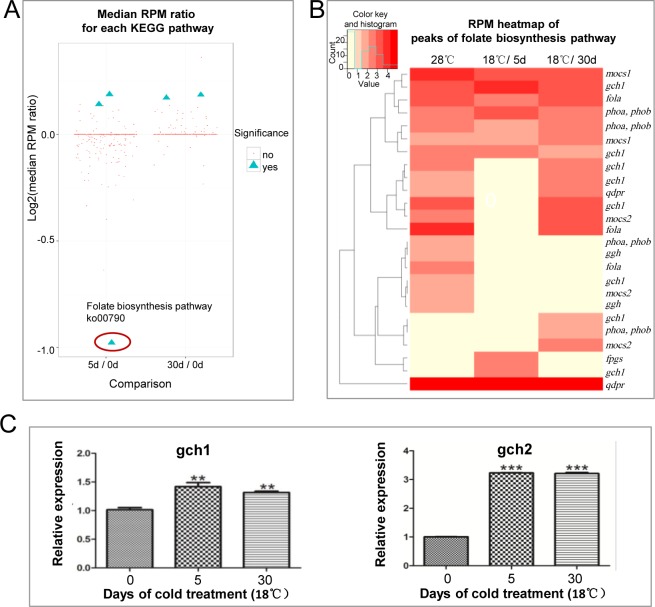
Fig 3. Folate biosynthesis pathway (ko00790) was differentially distributed in 5- day cold treated cells.
A. Differentially distributed KEGG pathways in cold treated cells compared with control cells. Wilcoxon signed-rank test was applied to identify KEGG pathways of which related peak-RPM values are differentially distributed in any of the two sample pairs (5d/0d: 18°C /5d vs 28°C, 30d/0d: 18°C /30d vs 28°C). We identified 5 KEGG pathways as differentially distributed that meet the criteria of P value < = 0.05 and Median RPM Ratio > = 1.1 or < = 1/1.1 (marked by blue solid triangles). Red dots present non-significantly changed KEGG. Folate biosynthesis pathway (ko00790) is marked by red circle. B. RPM heatmap of methylation peaks of folate biosynthesis pathway. Peak-RPM of folate biosynthesis pathway in three different samples (28°C, 18°C /5d, 18°C /30d) is shown by the density of the red color. C. RT-qPCR analysis of gch1 and gch2 genes. Relative expression was carried out by the comparative threshold cycle (CT) method. Statistical analysis was performed using GraphPad Prism 5 software. The Student t test was used on measurements from18°C /5d, 18°C /30d and 28°C samples from 3 experimental replicates.

