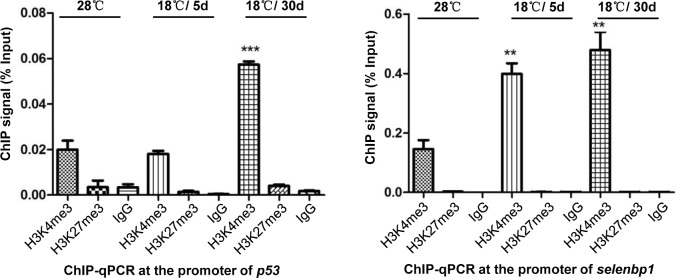
Fig 7. Enrichment of H3K4me3 and H3K27me3 at promoter regions of p53 and selenbp1 gene.
ChIP assays were performed in 28°C, 18°C /5d and 18°C /30d samples with H3K4me3, H3K27me3 and IgG antibodies. Primers specific for the promoters of p53 (A) and selenbp1 (B) were used for quantitative PCR of ChIP DNAs. Relative quantitation was carried out by the comparative threshold cycle (CT) method. Statistical analysis was performed using GraphPad Prism 5 software. The Student t test was used on measurements of enrichment from 18°C /5d, 18°C /30d and 28°C samples from 3 replicates. Error bars represent standard deviations (SD) (n = 3). An asterisk represents significant difference of enrichment compared to 28°C sample (P<0.05). **: P<0.01, ***: P<0.001.

