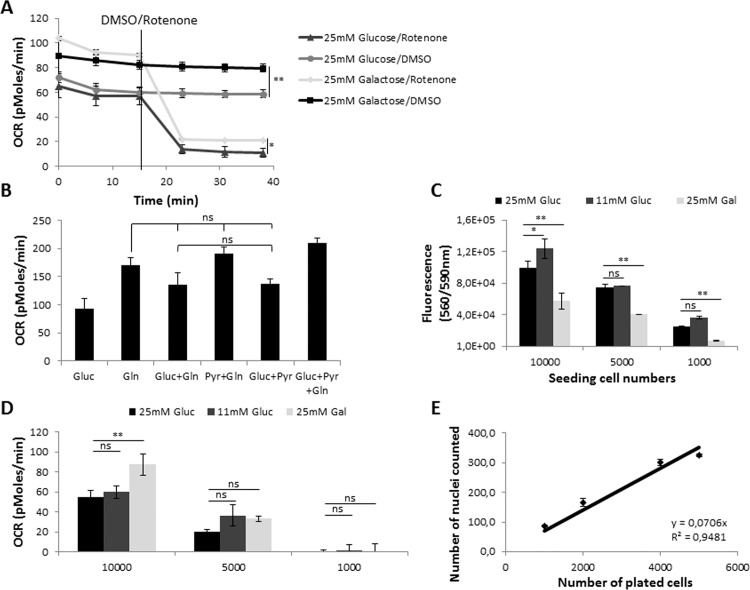
Fig 2. Optimization of screening conditions in Mia PaCa-2 cells.
(A) Oxygen consumption measurements (OCR) of Mia PaCa-2 cells in 25mM glucose or 25mM galactose. The Complex I inhibitor rotenone (1 μM) was used as a positive control for the inhibition of OxPhos, n = 6; (B) Measurement of OCR in media supplied with different carbon sources: 25 mM Glucose, 2 mM Glutamine, 2 mM Na Pyruvate, n = 12; (C) CellTiter Blue fluorescence measurements of cell titrations cultured in different assay media for 2 hrs, n = 12; (D) OCR measurements of Mia PaCa-2 cell titrations in different assay media, n = 12; (E) Nuclei number count using Hoechst stain in Seahorse plate, n = 12. For A, t-test was performed, *, p-value is 0.01 to 0.05; **, p-value is 0.001 to 0.01; B, Tukey’s Multiple Comparison ANOVA Test was performed. Groups are significantly different unless indicated otherwise. For C and D, two-tailed t-test was performed, ns, not significant, p>0.05, *, p-value is 0.01 to 0.05; **, p-value is < 0.01.

