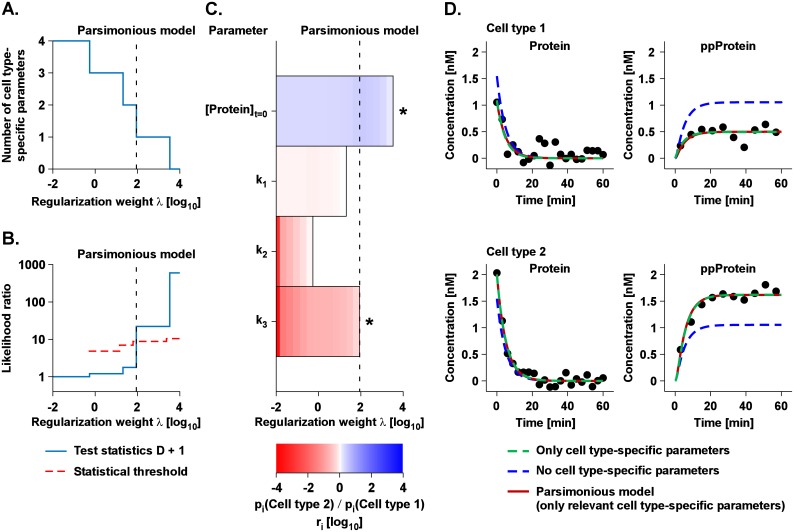
Fig 3. L1 regularization recovers cell type-specific parameters.
(A) The dependency of the predicted number of cell type-specific parameters and the regularization weight λ is shown. (B) The likelihood ratio test was performed for each number of cell type-specific parameters. If the test statistics (blue), i.e. the mismatch between data and model, is larger than the statistical threshold (red dashed), the regularization weight λ was too large hence the model was rejected. The crossing of the blue and the dashed red line corresponds to the parsimonious model (dashed black line). (C) The regularization path of the four parameters fold-changes is shown. The regularization-dependent parameter differences are indicated with shades of red (higher in cell type 1) to blue (higher in cell type 2). The asterisks indicate the identified parameter differences. (D) Model trajectories and simulated data for three exemplary scenarios. The dashed green line shows the dynamics for only cell type-specific parameters. In contrast, the blue line displays the model trajectories for no cell type-specific parameters, which is unable to describe the simulated data. Finally, the parsimonious model (solid red) is able to describe the simulated data with only two relevant cell type-specific parameters recovering the simulated parameter differences.

