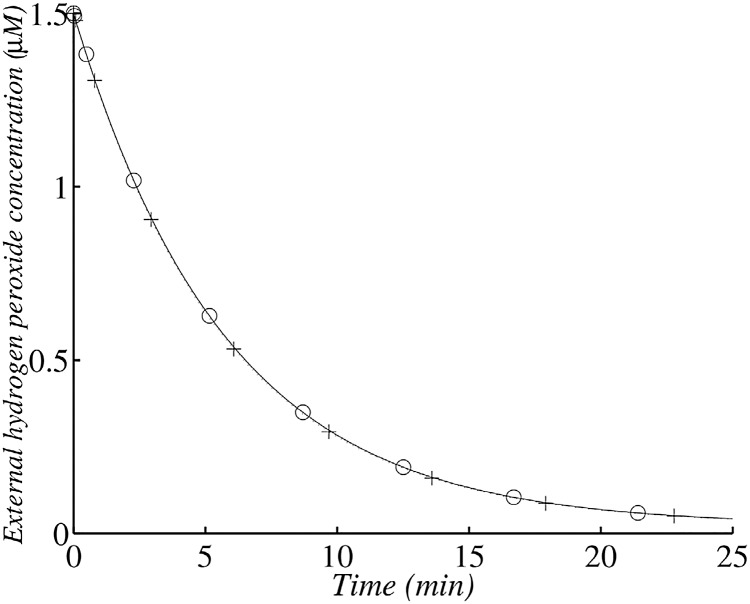
Fig 8. Changes in external H2 O2 concentration in the wild type after the addition of 1.5 μM exogenous H2 O2 with 1.45 × 10⁷ cells ml−1.
(+) corresponds to the analytical solution according to the simplified system and (∘)) corresponds to the numerical solution of the whole model. The simulation was run with 1.45 × 10⁷ cells ml−1 (corresponding to an OD680 value of 0.1).

