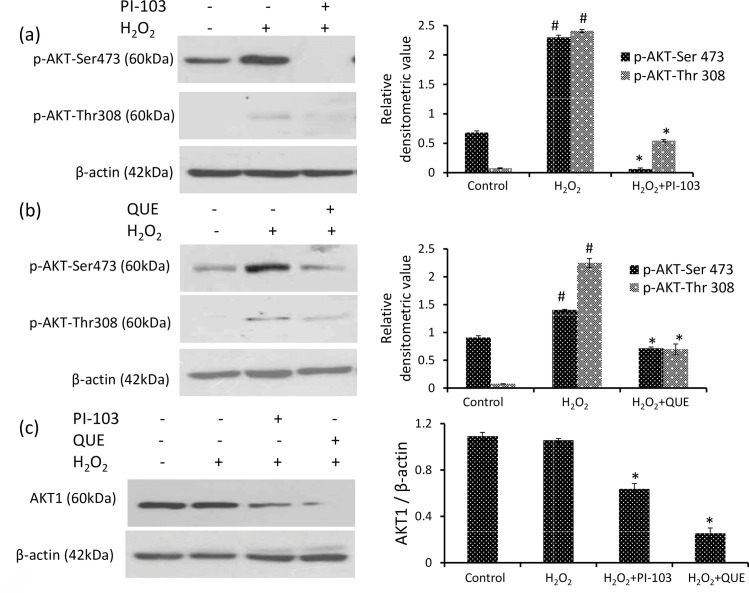
Fig 5. PI-103 and QUE attenuate phosphorylation of AKT Thr-308 & AKT Ser-473.
(a) and (b) Western analysis of phospho AKT Thr-308, AKT Ser-473 and respective densitometric scanning of band after normalization with β-actin. (c) Western analysis of AKT1 and respective densitometric scanning of band after normalization with β-actin. DLA cells were pre-treated with PI-103 and QUE; then post-treated with H2O2. Data represent as mean ± S.E.M. * (#) denotes significant differences at level of p < 0.05. # indicates significant difference between control vs H2O2-treated group; and * H2O2 treated groups vs PI-103/QUE treated group.

