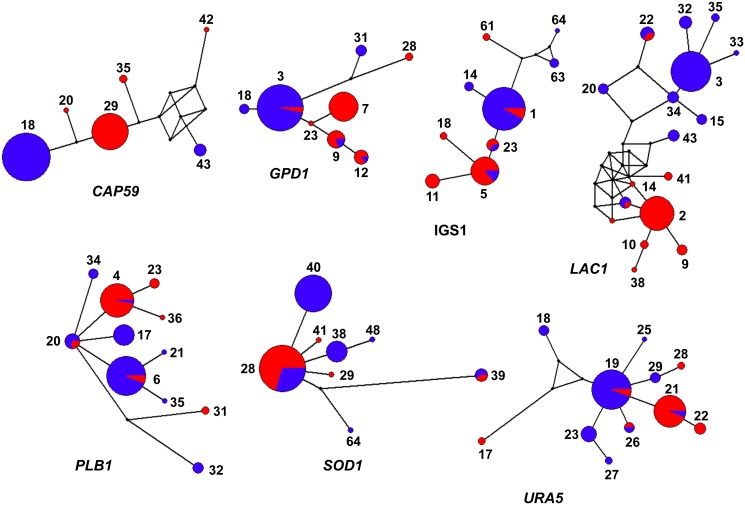
Fig 3. Haplotype network analysis by locus of the studied Cryptococcus gattii molecular type VGIII isolates.
Networks were constructed using the software Network 4.6.1.3. The size of the circles is proportional to the number of isolates. Color of the circles indicates serotype B (blue) and serotype C (red). Dual-coloration represents shared alleles between serotypes. Alleles for each locus are indicated numerically.

