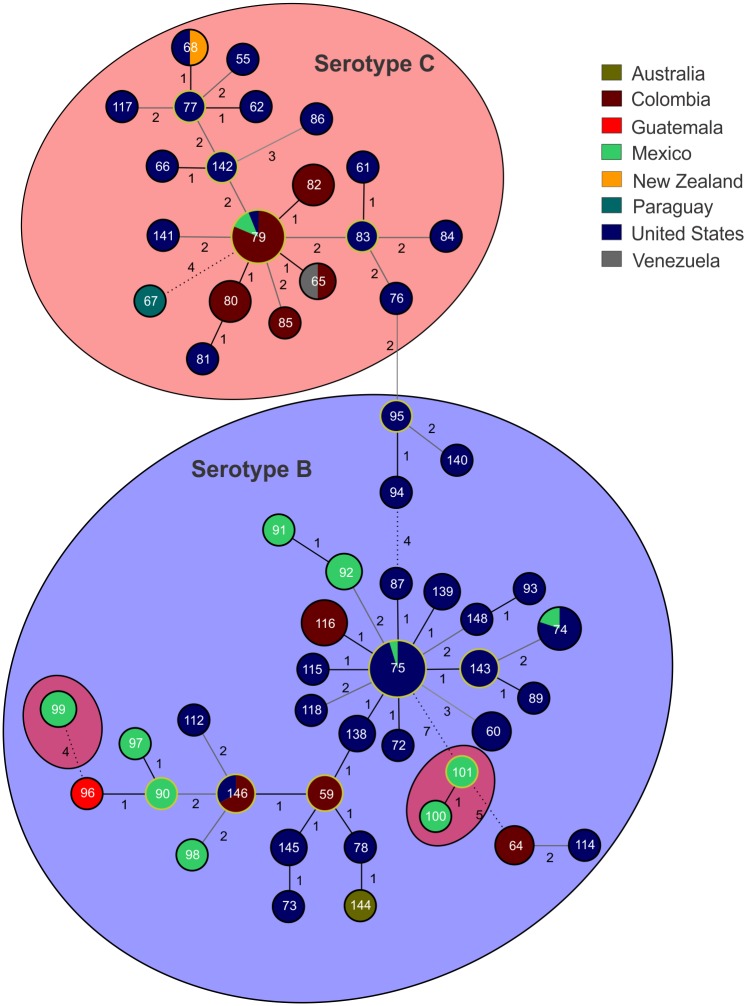
Fig 4. Minimum spanning tree of the studied Cryptococcus gattii molecular type VGIII isolates.
The tree was constructed using the goeBURST algorithm and shows the distribution of the STs according to the country of origin and the serotype B (blue) or serotype C (red) status of the isolates. STs are indicated numerically inside the circles. The size of the circles is proportional to the number of isolates per each ST. Circles surrounded by yellow lines represent the founder of each clonal complex. Numbers between STs represent one (black solid line), two (dark grey line), three (light grey line), and more than four (dashed line) allele differences.

