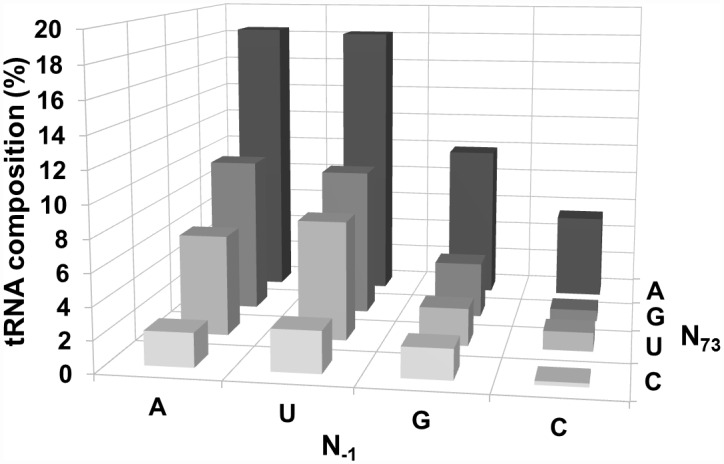
Fig 6. Analysis of N-1:N+73 identities in mitochondrial and chloroplast tRNAs.

Analysis of N-1:N+73 identities in 423 mitochondrial and chloroplast tRNAs from eight different green algae and plants (sequences obtained from http://plantrna.ibmp.cnrs.fr/). Table A in S1 file lists the individual distributions in each species.
