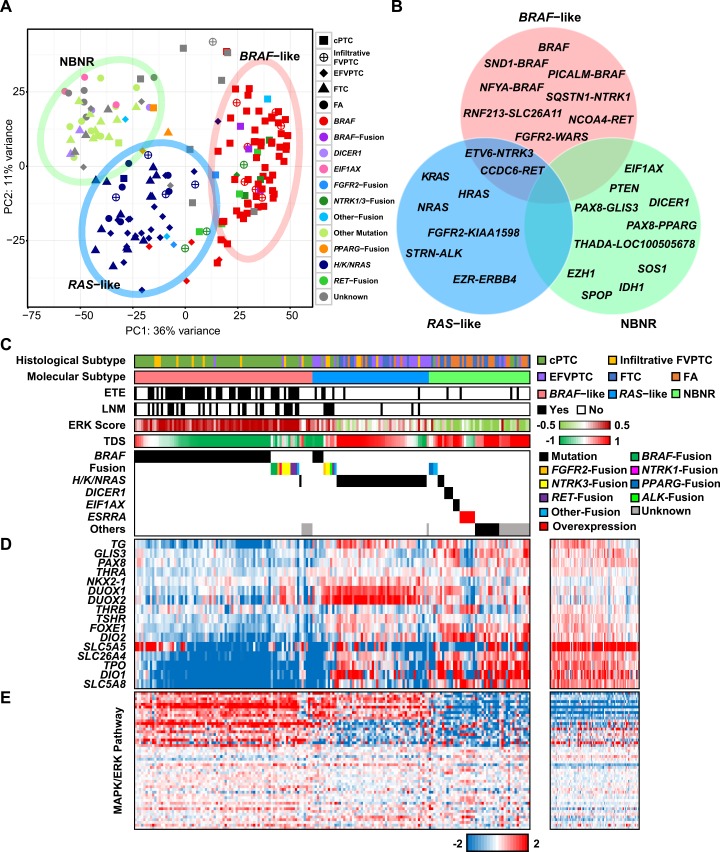
Fig 2. Gene expression analysis on thyroid tumors.
(A) The result of K-means clustering via PCA. Three distinct molecular subtypes were found: BRAF–like, RAS–like, and NBNR. Each cluster was represented by a 95.00% confidence ellipse. (B) Driver gene of three molecular subtypes. (C) Histological subtype, molecular subtype, the presence of extrathyroidal extension, the presence of lymph node metastasis, ERK score, TDS, and driver gene in individual samples. 180 tumors were sorted by molecular subtype, driver gene, and high to low TDS. (D) The heat maps represent expression level of 16 thyroid metabolism and function genes and (E) the MAPK signaling pathway genes in tumor (middle) and normal (right) specimens. Genes were clustered by K-means clustering algorithm (K = 3).

