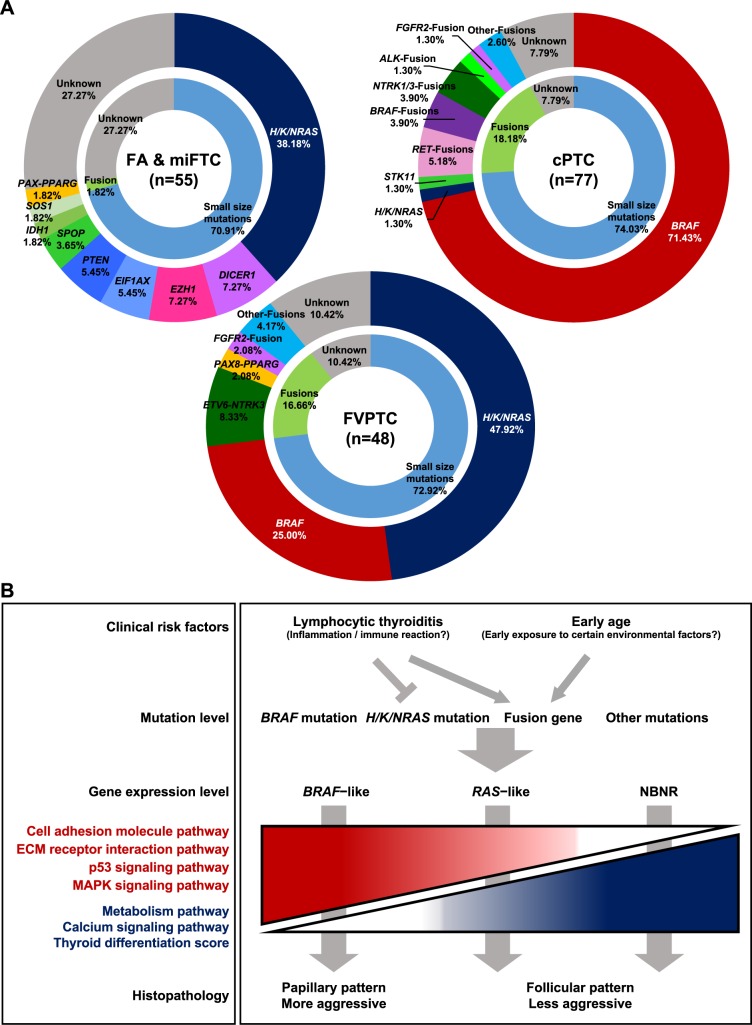
Fig 5. The overview of the present study.
(A) The driver mutations in thyroid tumors. Each pie chart represents the distribution of driver mutations identified in FTN, FVPTC, and cPTC, respectively. (B) A schematic model of thyroid cancer progression integrating clinical risk factors, mutational, transcriptional profile, and clinical presentation. Tumor aggressiveness was determined by the presence of invasive pathologic characteristics of ETE or LNM.

