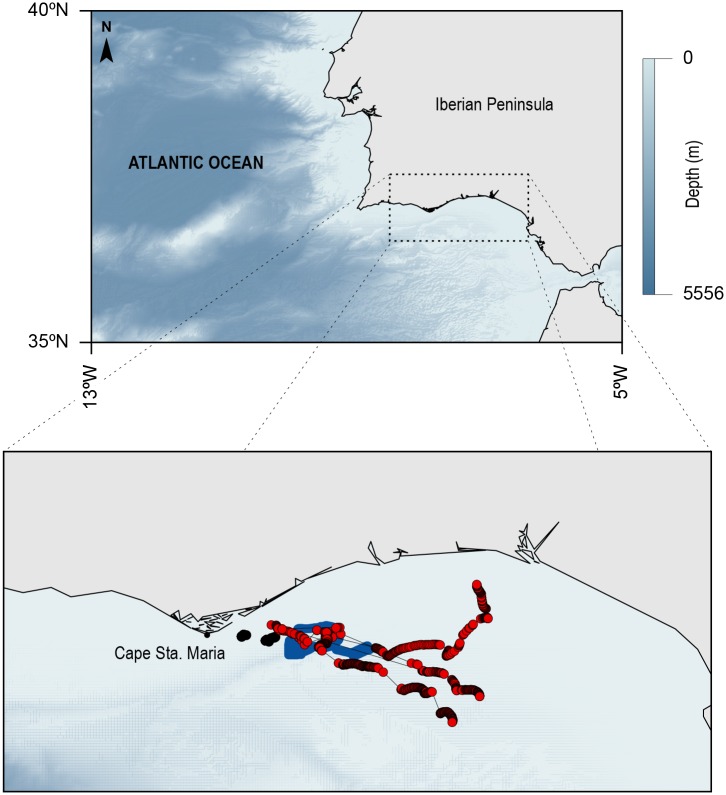
Fig 2. Map defining the study region, SW Iberian, including the northern margin of the Gulf of Cadiz and the Strait of Gibraltar.
Bathymetric chart noted by the blue bar. Detailed tracks recorded in this study are represented in the inset and all tracks recorded (AUV—black; WaveGlider—blue and sunfish GPS—red dots).

