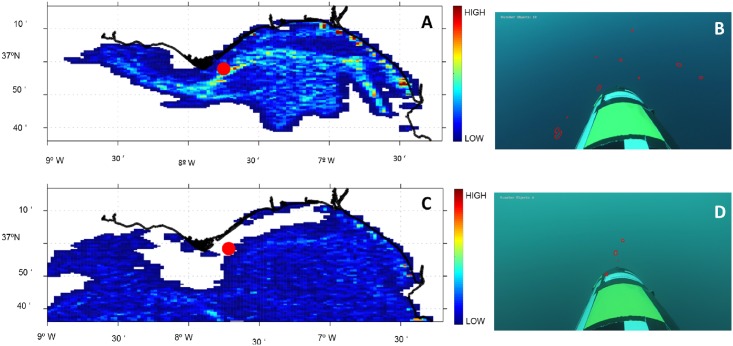
Fig 5. Lagrangian model particle concentration at subsurface (2 m depth) (A) for May 18th, (C) for May 19th.
The red dot denotes the starting position for the particles simulation. Panels B and D show the results of the image analysis of two video recorded frames, with particles circled in red. Increased particle numbers in B, compared to C, match the higher density estimated found with the model.

