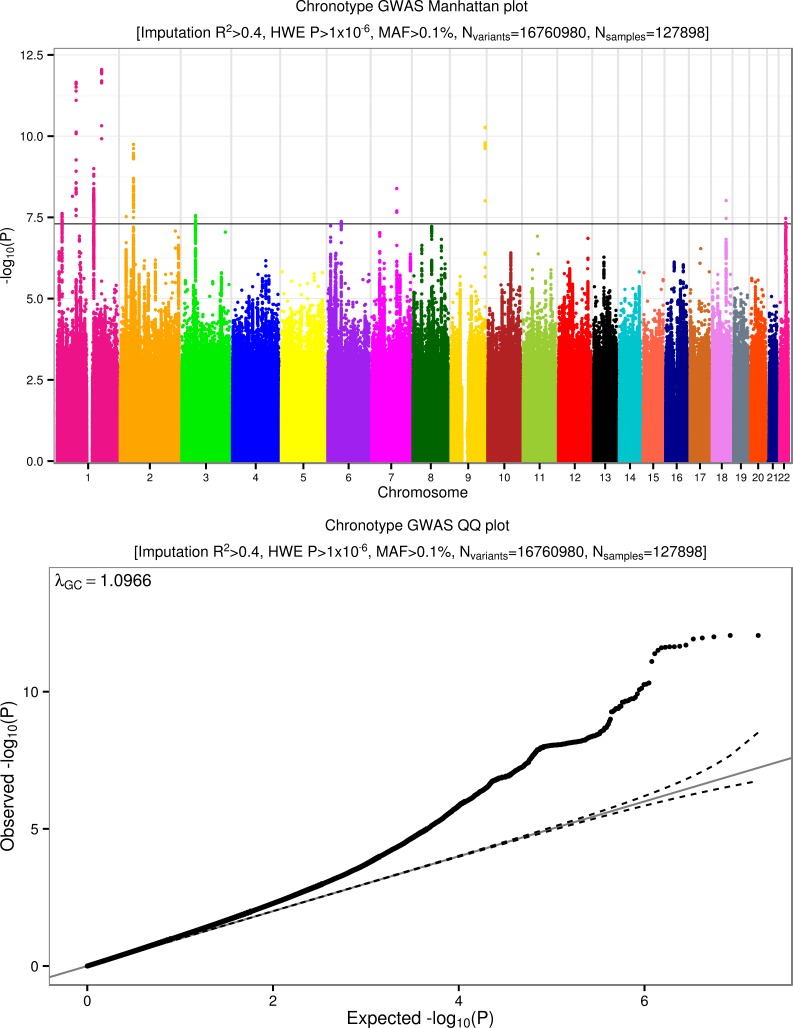
Fig 1. Manhattan and quantile-quantile (QQ) plots for chronotype.
Summary information plots for inverse-normalised (self-report) chronotype score vs. ~16.8 million imputed genetic variants in 127,898 White British individuals in the UK Biobank study. The Manhattan plot (top) shows association test (-log10 P-value on the y-axis against physical autosomal location on the x-axis. The standard genome-wide significance cutoff of P = 5x10⁻⁸ is shown by the horizontal black line. Variants tested had imputation R2>0.4, a Hardy-Weinberg Equilibrium (HWE) P-value > 1x10⁻⁶ and minor allele frequency (MAF) > 0.1%. The QQ (quantile-quantile) plot (bottom) identifies some inflation (λGC = 1.097) but this is consistent with expected inflation from a highly polygenic trait in such a large sample size [15].

