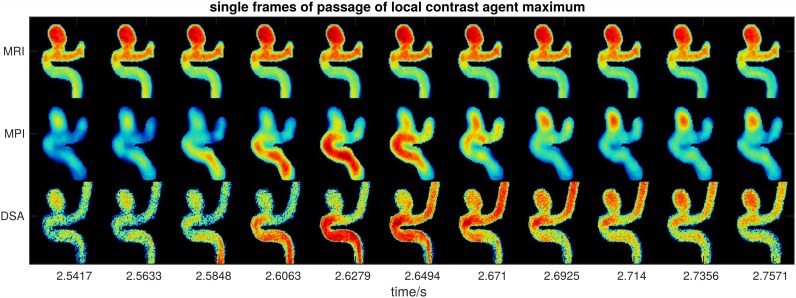
Fig 4. Multiple frames of dynamic MRI, MPI, and DSA measurements during the passage of a local maximum of contrast agent concentration (see time points 2.5 s-2.8 s in Fig 2).
The passage of the contrast agent bolus through the main vessel of the model can be estimated in MPI and DSA, but not in MRI. A movie showing all frames of the dynamic scans is available as S3 Video.

