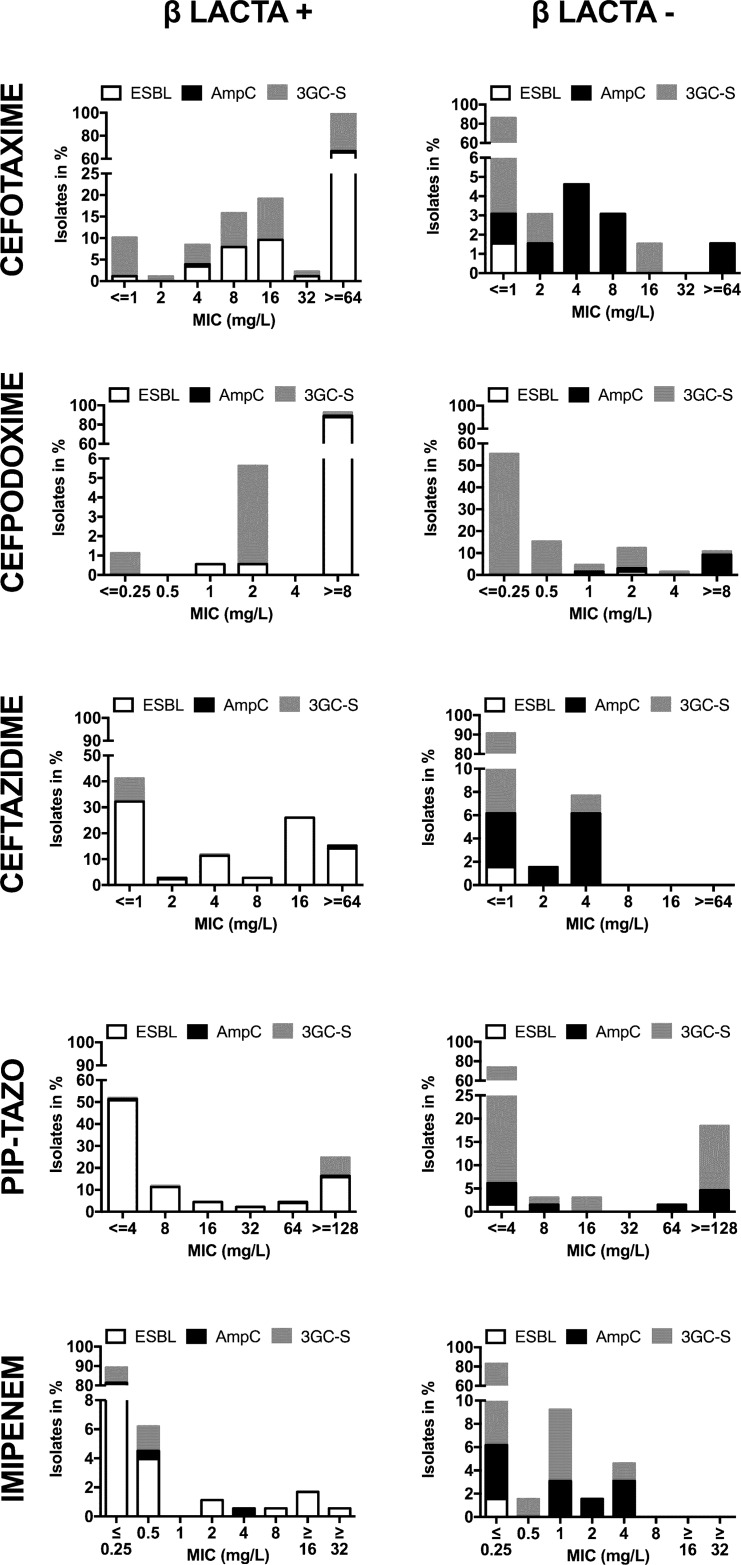
Fig 1. βLACTATM results in regards to distribution of MICs and ESBL or AmpC.
The graphs depict the MIC of cefotaxime (A), cefpodoxime (B), ceftazidime (C), piperacillin/tazobactam (D) and imipenem (E) in the positive (left) and negative (right) βLACTATM fractions. Information on ESBL activity (white), AmpC expression (black) and 3GC susceptibility (3GC-S, grey) is provided.

