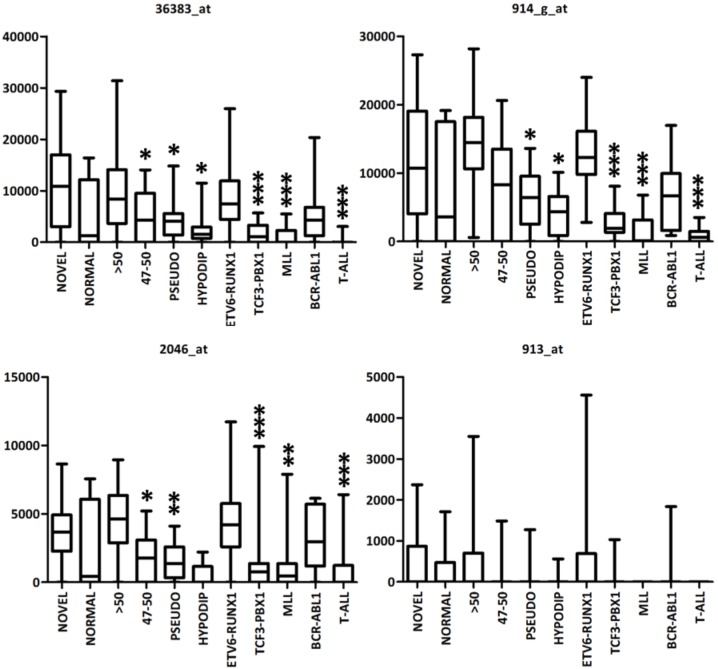
Fig 5. Expression of probe sets annotated to ERG coding region in ALL subgroups.
Normalized expression levels (Y axis) of 4 probe sets annotated to ERG exons in 11 ALL subgroups (X axis): ERGdel enriched B-other ALL (NOVEL, n = 14), B-other ALL with normal karyotype (NORMAL, n = 11), high hyperdiploid ALL (>50, n = 63), ALL with 47–50 chromosomes (47–50, n = 21), ALL with pseudodiploid karyotype (PSEUDO, n = 25), ALL with <47 chromosomes (HYPODIP, n = 9), ETV6-RUNX1-positive ALL (ETV6-RUNX1, n = 79), TCF3-PBX1-positive ALL (TCF3-PBX1, n = 27), MLL-rearranged ALL (MLL, n = 20), BCR-ABL1-positive ALL (BCR-ABL1, n = 15) an T-ALL (n = 43). Boxes extend from the 25th to 75th percentiles, the lines in the middle represent medians, and the whiskers extend to minimal and maximal values. ALL subgroups labeled with asterisks have significantly different expression compared to ERGdel associated B-other ALL subgroup: * −0.01 < p ≤ 0.05; ** −0.001 < p ≤ 0.01; *** −p ≤ 0.0001 (Mann-Whitney U test).

