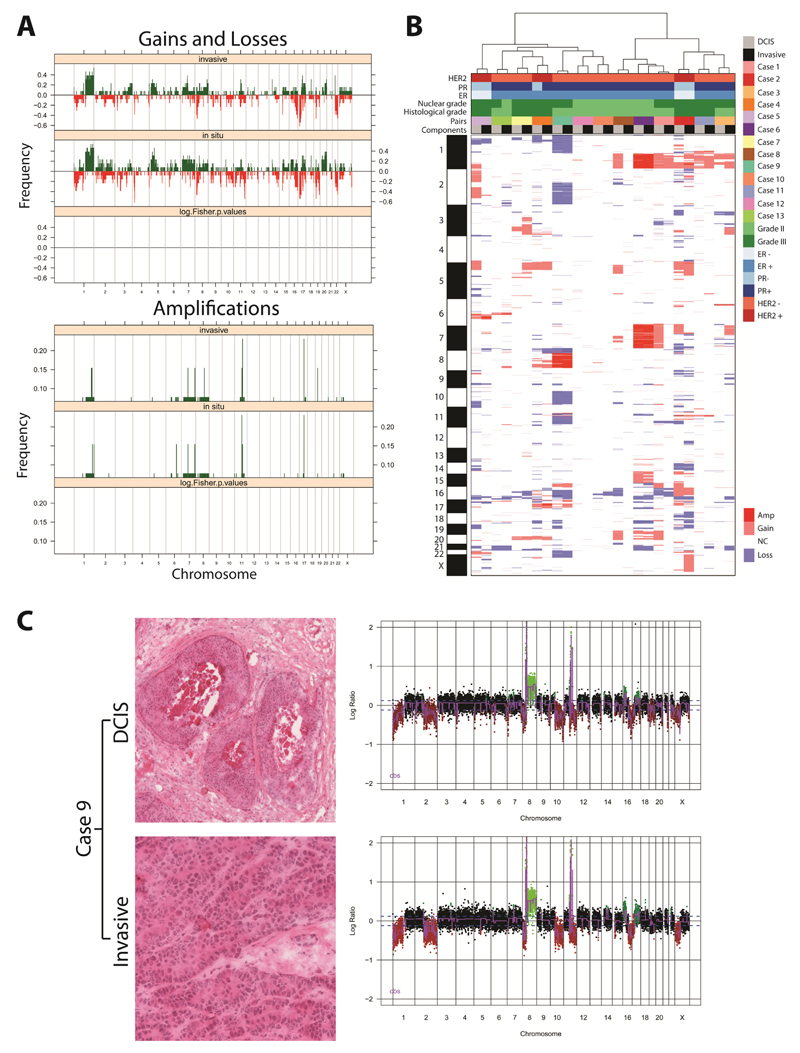
Figure 1. DCIS and adjacent invasive breast carcinomas have similar patterns of gene copy number aberrations.
(A) Frequency plot of copy number gains and losses (top) or amplifications (bottom) in 13 matched in situ and adjacent invasive breast carcinomas. The proportion of tumours in which each bacterial artificial chromosome (BAC) clone is gained (green bars) or lost (red bars) is plotted (Y-axis) for each BAC clone according to its genomic position (X-axis). No significant differences were identified between the two components. (B) Hierarchical cluster analysis performed with microarray comparative genomic hybridisation (aCGH) cbs-smoothed ratios using a correlation distance metric and the Ward’s algorithm of the 13 matched samples. The components from each pair of synchronously diagnosed matched DCIS and invasive breast cancer preferentially clustered together. (C) Representative micrographs of the DCIS and its adjacent invasive component from the frozen section of Case 9 subjected to microdissection (left) and their respective genome plots (right). In the genome plots, the genomic position is plotted along the X-axis and cbs-smoothed Log2 ratio on the Y-axis; amplifications are shown in bright green, gains in dark green, losses in dark red, and normal copy number in black. Amp: amplification; ER: oestrogen receptor; Gain: copy number gain; Loss: copy number loss; NC: no copy number change; PR: progesterone receptor.

