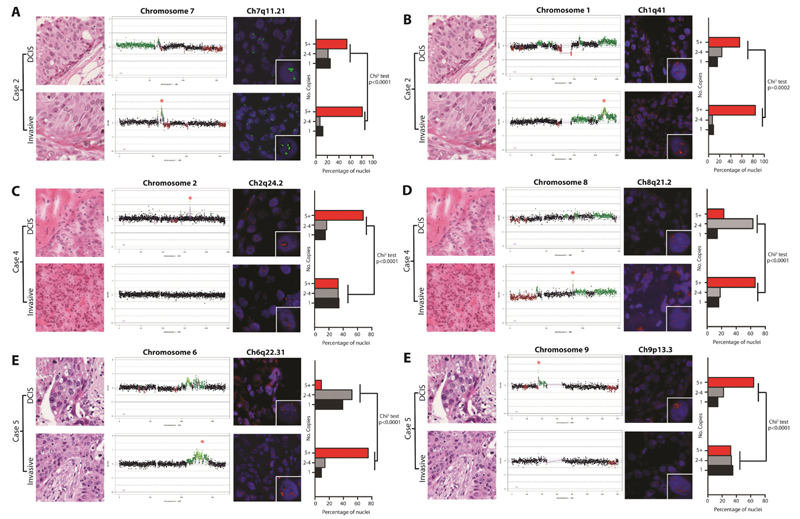
Figure 3. Fluorescence in situ hybridisation (FISH) demonstrates intra-tumour genetic heterogeneity and genetic differences between matched DCIS and adjacent invasive breast carcinomas.
FISH was performed with in-house probes for genetic loci displaying differences in copy number as defined by microarray-based comparative genomic hybridisation in three cases (A-F). For each locus, a representative micrograph of each component, a chromosome plot denoting the region probed (marked by a red star in the component with the highest Log2 ratio), representative FISH images and a bar plot showing the proportions of nuclei containing 1, 2-4 or 5+ copies (at least 100 nuclei were scored in each component) are shown. In the chromosome plots, genomic position is plotted along the X-axis and cbs-smoothed Log2 ratio on the Y-axis, amplification and gains are shown in bright and dark green, while losses are shown in dark red, and normal copy number in black. FISH images show nuclei counterstained with DAPI, and FISH probes labelled either with Digoxigenin (green signals) or Biotin (red signals). Inset images of single amplified cells are depicted in the bottom right corner of each FISH image. Bar graphs contain red bars denoting regions with 5+ copies, grey bars with 2-4 copies and black bars with 1 copy. Significant differences were determined using the Chi-square test.

