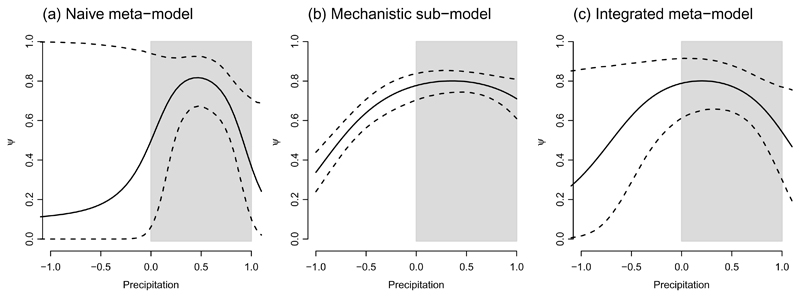
Figure 2.
Comparison of the naive model, mechanistic sub-model, and the integrated model showing the probability of presence (ψ) as a function of precipitation. Uncertainty is represented as dashed lines, showing the limits of 90% Bayesian credible intervals. The shaded region shows the calibration range for the naive model. (a) Naive model, using only presence-absence data. Uncertainty increases dramatically when attempting to project beyond the scope of the source data. (b) Mechanistic model, using observations of an experiment to infer probability of presence. (c) Integrated model, showing predictions that are intermediate between the two sub-models and uncertainty that is reduced compared to (a).

