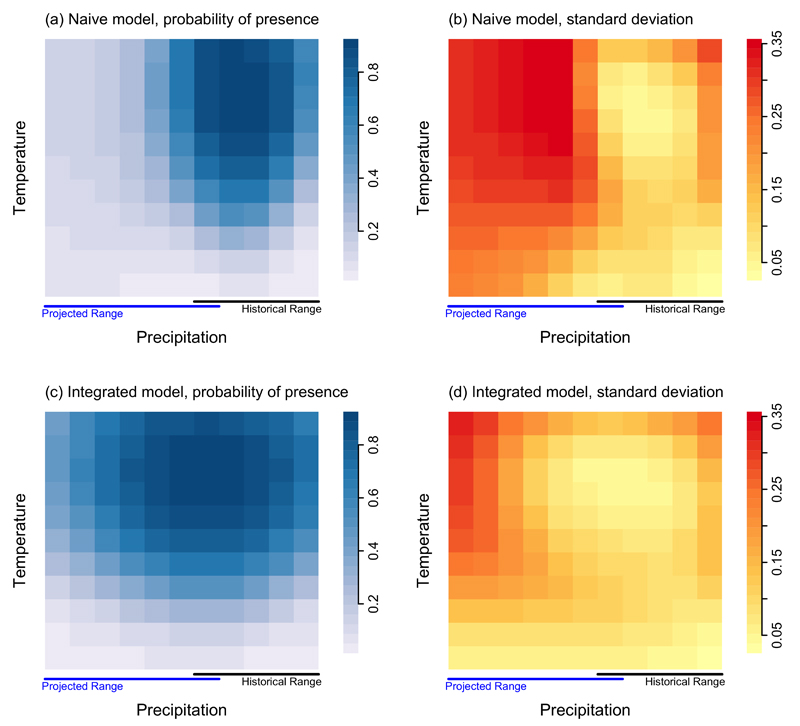
Figure 3.
Maps showing the predicted probability of presence (ψ; (a) and (c)) and the standard deviation of ψ ((b) and (d)) for the naive and integrated models. Historical (i.e., where presence-absence samples were available) and predicted future precipitation regimes are shown below the horizontal axes.

