
Fig. 2. Comparison between experimental and numerical results for packing of colloids at the interface.
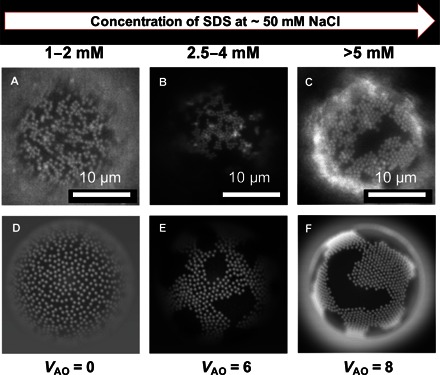
(A to C) Fluorescence micrographs (under green fluorescent protein illumination) showing change in the packing of the 0.52-μm PS colloids on the surface of ODs as a function of SDS concentration in the bulk of the sample. The colloids go from a colloidal gas-like phase (A) to a liquid-like cluster (B) to a well-aligned hexagonal packing at the interface (C). (D to F) Snapshots for different strengths of the Asakura-Oosawa (AO) potential: VAO = 0 (D), 6 (E), and 8 (F) (simulation details are in the Supplementary Materials). These images were modulated with a Gaussian blur emulating the experimental situation.