
FIGURE 3.
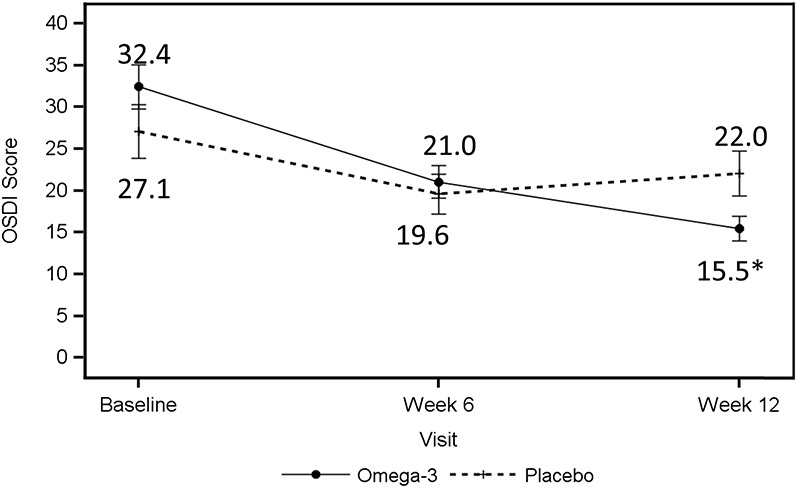
OSDI symptom scores reported at baseline and at the 6- and 12-week visits. The solid line indicates the average OSDI scores in the omega-3 group; the dashed line indicates the average OSDI scores in the control group. *P value < 0.05.
Official websites use .gov
A
.gov website belongs to an official
government organization in the United States.
Secure .gov websites use HTTPS
A lock (
) or https:// means you've safely
connected to the .gov website. Share sensitive
information only on official, secure websites.
OSDI symptom scores reported at baseline and at the 6- and 12-week visits. The solid line indicates the average OSDI scores in the omega-3 group; the dashed line indicates the average OSDI scores in the control group. *P value < 0.05.