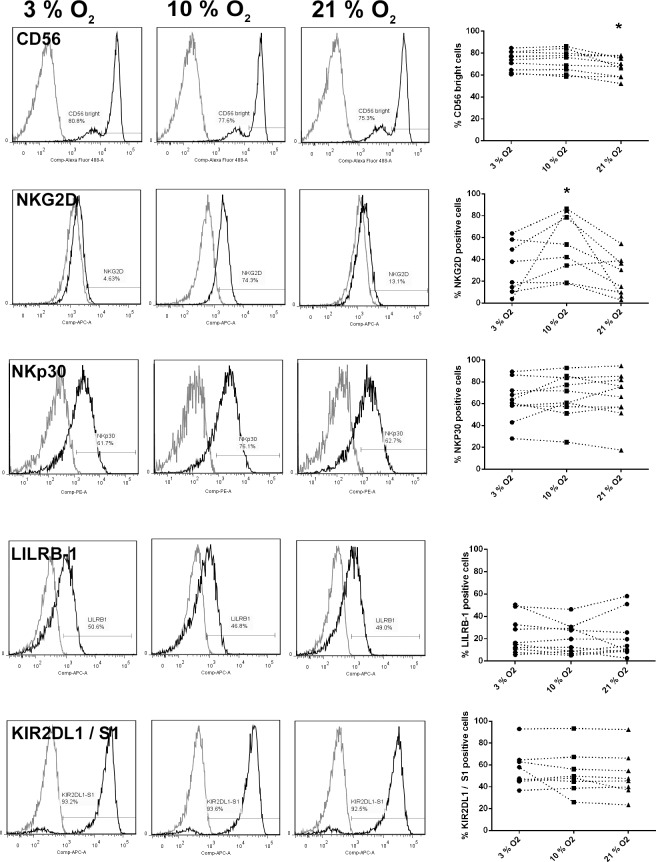
FIG. 3.
Surface expression of receptors on dNK cells cultured for 24 h in 3%, 10%, or 21% O2. Data indicate representative phenotypes and pooled data for dNK cells after 24 h in culture, assessed by flow cytometry for the cell surface receptors listed. Gray line = IgG control, and darker line = test antibody. Data points show individual patient samples (n = 8).

