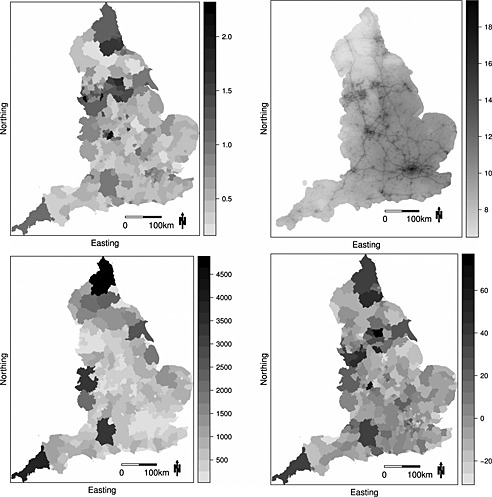
Figure 1.

The top left panel displays the standardised morbidity ratio for hospital admissions due to respiratory disease in 2010, while the top right panel presents the modelled annual mean concentrations of particulate matter less than 2.5μm at a 1‐km2 resolution. The bottom left panel displays the number of modelled pollution concentrations in each local and unitary authority, while the bottom right panel displays the residuals from fitting a simple Poisson generalised linear model to the data
