
Figure 2.
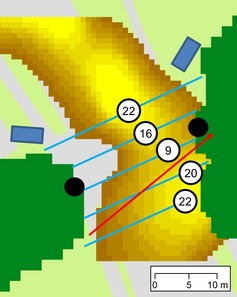
A gap in an urban tree line caused by a road, as represented in the GIS. Dark green areas represent tree cover >4 m high, and the variation in road surface lux is indicated by the yellow gradient. Parallel transects (blue lines) were used to provide an indication of potential crossing routes, the distance of these routes, and the maximum lux that they encounter (indicated by numbered circles). Actual bat crossing routes (red arrow) were mapped based on surveyor (black circle) observations and confirmed based on camera (blue rectangle) recordings.