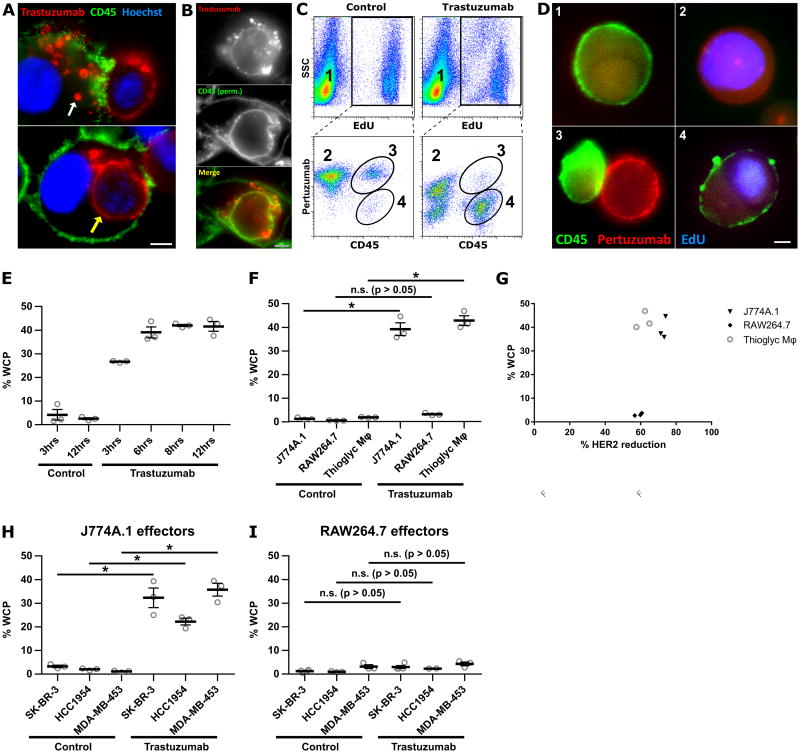
Figure 2.
J774A.1 and RAW264.7 macrophages exhibit different phagocytic activities. A, MDA-MB-453 cells were harvested and opsonized by incubation with 10 μg/ml Alexa 555-labeled trastuzumab at room temperature for ten minutes followed by washing. The opsonized cancer cells (2.5×10⁴ cells/imaging dish) were added to adhered, IFNγ-activated J774A.1 macrophages (4×10⁴ cells) for 30 minutes and the samples fixed and stained. Trogosomes and a completely engulfed cancer cell are indicated by white and yellow arrows, respectively. B, J774A.1 macrophages and MDA-MB-453 cells were incubated as in A, fixed, permeabilized and mouse CD45 detected using FITC-labeled mouse CD45-specific antibody. C, representative flow cytometry plots to show the identification of the whole cell phagocytosis (WCP) population. Macrophages were plated for 18 hours, followed by addition of EdU-treated cancer cells at a 10:1 effector:target cell ratio in the presence of 1 μg/ml trastuzumab or PBS vehicle for 6 hours. The samples were then harvested and stained for mouse CD45 (macrophages) and cancer cells accessible to the medium were detected using labeled pertuzumab. The following cell populations can be identified: macrophage only (1); cancer cell only (2); macrophage:cancer cell conjugate (3); macrophage that has performed WCP (4). D, fluorescence microscopy images of cells representative of the populations numbered 1, 2, 3 and 4 in panel C. E, time-course of WCP using J774A.1 macrophages and MDA-MB-453 cancer cells. F, comparison of WCP activity using different macrophage cells with MDA-MB-453 cells after co-incubation for 6 hours. G, plot of percentage WCP against percentage HER2 reduction for the data shown in Fig. 2F. The percentage of HER2 reduction from the cell surface was calculated from the ratio of the surface pertuzumab (MFI) remaining in the non-phagocytosed cancer cell population to surface pertuzumab (MFI) in samples without antibody treatment. H,I, comparison of WCP activity using J774A.1 (H) or RAW264.7 (I) macrophages with different breast cancer cell lines after co-incubation for 6 hours. Control in panels C, E-I, represent co-cultures incubated without trastuzumab. Error bars represent standard errors. Student's t-test was performed to indicate statistical significance (denoted by *; p < 0.05). n.s., no significant difference (p>0.05). For panels A, B and D, scale bars = 5 μm.

