Figure 4.
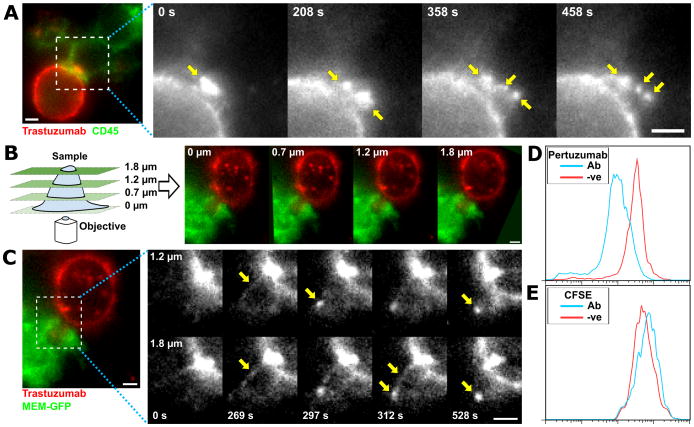
Fluorescence microscopy analyses using MUM reveals that trogocytosis involves tubular extensions of the cancer cells. A, individual frames from a live imaging experiment of MDA-MB-453: RAW264.7 cell conjugates. The cancer cells were opsonized by incubation with 10 μg/ml Alexa 555-labeled trastuzumab at room temperature for ten minutes followed by washing. These cells were added to IFN-γ-activated RAW264.7 macrophages expressing MEM-GFP (to label the plasma membrane; pseudocolored green) plated in dishes 30 minutes prior to imaging at a 1:1 effector:target cell ratio (2.5×10⁴ cells). Grayscale images represent individual frames of the trastuzumab signal for the boxed region in the pseudo-colored image showing trastuzumab (red) and MEM-GFP (green) signals. Yellow arrows indicate punctate structures accumulating inside the macrophage. B, schematic diagram of the MUM configuration and representative images from multiple focal planes of a macrophage:cancer cell conjugate formed between IFN-γ-activated MEM-GFP expressing RAW264.7 macrophages and MDA-MB-453 cancer cells opsonized with Alexa 555-labeled trastuzumab as above. C, individual frames showing the trastuzumab signal (black and white panels) of live cell imaging from two focal planes displaying a trogocytic event involving tubulation. Yellow arrows indicate intermediates in the tubulation process. Numbers in the lower part of each panel represent the acquisition time (seconds) for each image pair. The left panel shows an overlay of the MEM-GFP (pseudocolored green) and trastuzumab (pseudocolored red) at 1020 sec in the 1.8 μm focal plane. The boxed region is expanded in the grayscale images. D, E, flow cytometry analyses of pertuzumab and CFSE staining levels in MDA-MB-453 cells co-incubated with RAW264.7 macrophages as described in Fig. 1B. Scale bars = 5 μm.

