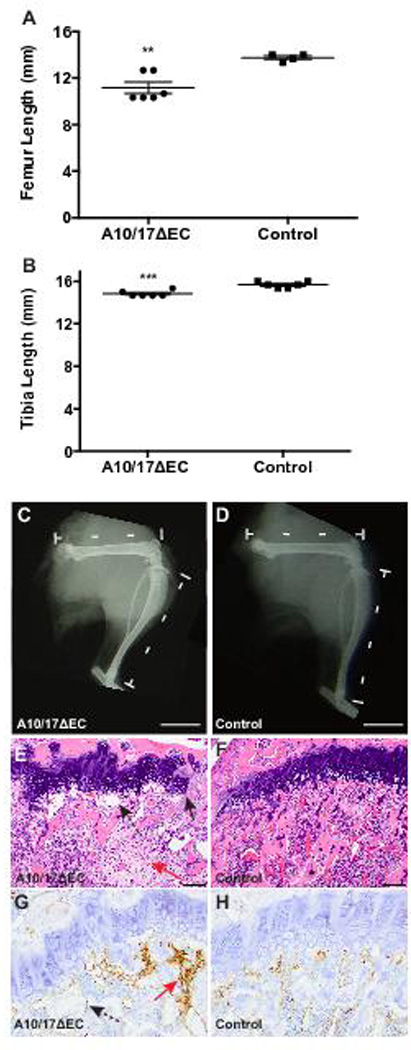
Figure 3. A10/17ΔEC long bone growth is disrupted.

A to B, The femurs (A) and tibiae (B) of 8-week old A10/17ΔEC mice are significantly shorter than in littermate controls. C,D, representative radiographs of the hindlimbs show a shorter femur and tibia in an A10/17ΔEC mouse (C) than in a A10flox/flox/A17flox/flox control (D). E to H. H&E and CD31 staining of femurs shows disruptions in the growth plate of A10/17ΔEC mice (E, arrow-solid line) and enlarged, abnormally oriented vessels under the growth plate (E and G, arrows-dashed line), and solid nests of CD31+ cells not forming vascular spaces (E and G, red arrows) in contrast to continuous growth plate and small, regularly spaced vessels adjacent to the control growth plate (F,H). Data shown as mean ± SEM. ** signifies p<0.01, *** signifies p<0.001, two-tailed student t-test. Radiographs shown are representative of 8-week old animals analyzed for each genotype (n=3 A10/17ΔEC, n=3 A10flox/flox/A17flox/flox). Scale bars, 4mm (C-D), 100µm (E-F), and 50µm (G-H).
