
Figure 6.
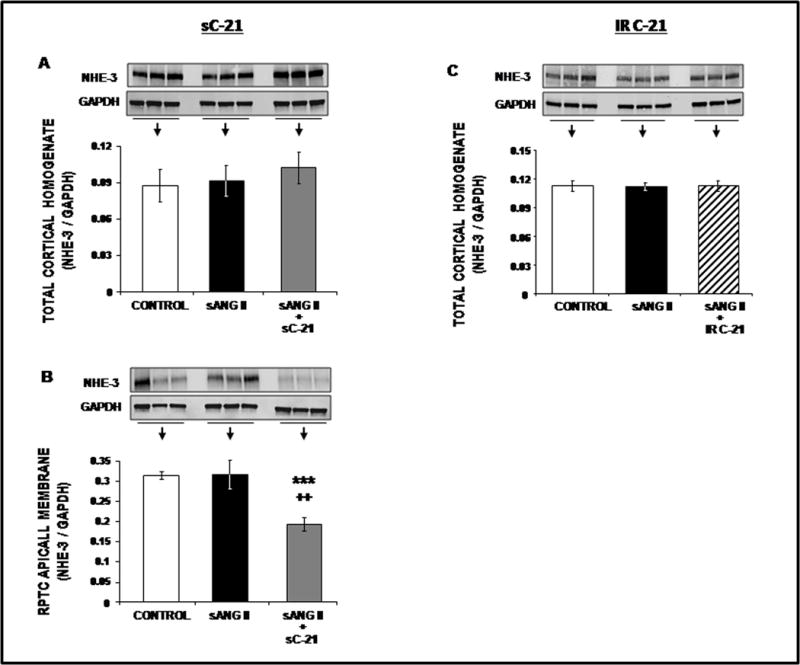
Western blot analysis of total cortical homogenate (Panels A and C) and RPTC apical membrane (Panels B) NHE-3 protein expression following 1 day of control (
 ), systemic ANG II (sANG II;
 ), sANG II + systemic C-21 (sC-21;
 ), and sANG II + intrarenal (IR) C-21 (
 ) treatments. All blots are normalized to GAPDH. Data represent mean ± 1 SE. ***P<0.01from control. ++P<0.001 from sANG II.