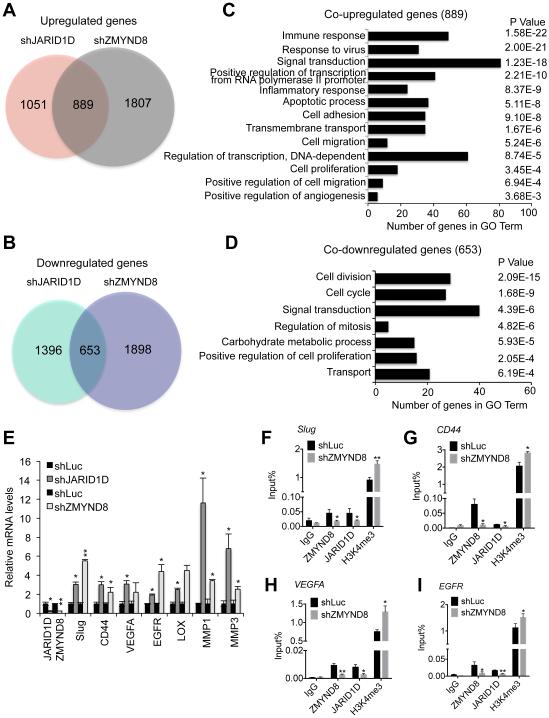
Figure 4. ZMYND8 is required for the JARID1D-mediated downregulation of metastasis-linked genes.
(A and C) Venn diagrams (A) and gene ontology analysis (C) of genes upregulated by JARID1D and ZMYND8 knockdown. Whole genome expression levels were measured by the RNA-seq. (B and D) Venn diagrams (B) and gene ontology analysis (D) of genes downregulated by JARID1D and ZMYND8 knockdown. (E) The effect of JARID1D or ZMYND8 knockdown on expression levels of multiple metastasis-linked genes in DU145 cells. A quantitative RT-PCR analysis was performed using samples from at least three independent experiments (i.e., n ≥ 3). (F–I) The effect of ZMYND8 knockdown on JARID1D and H3K4me3 levels at Slug (F), CD44 (G), VEGFA (H), and EGFR (I) genes in DU145 cells. Chromatin levels of ZMYND8, JARID1D, and H3K4me3 were measured by quantitative ChIP that was performed using samples from at least three independent experiments (i.e., three biological replicates). IgG was used as a negative control. Data are presented as the mean ± SEM (error bars). ChIP PCR amplicons are indicated by the small blue lines in Figures 7A-7D. See also Figure S2.

