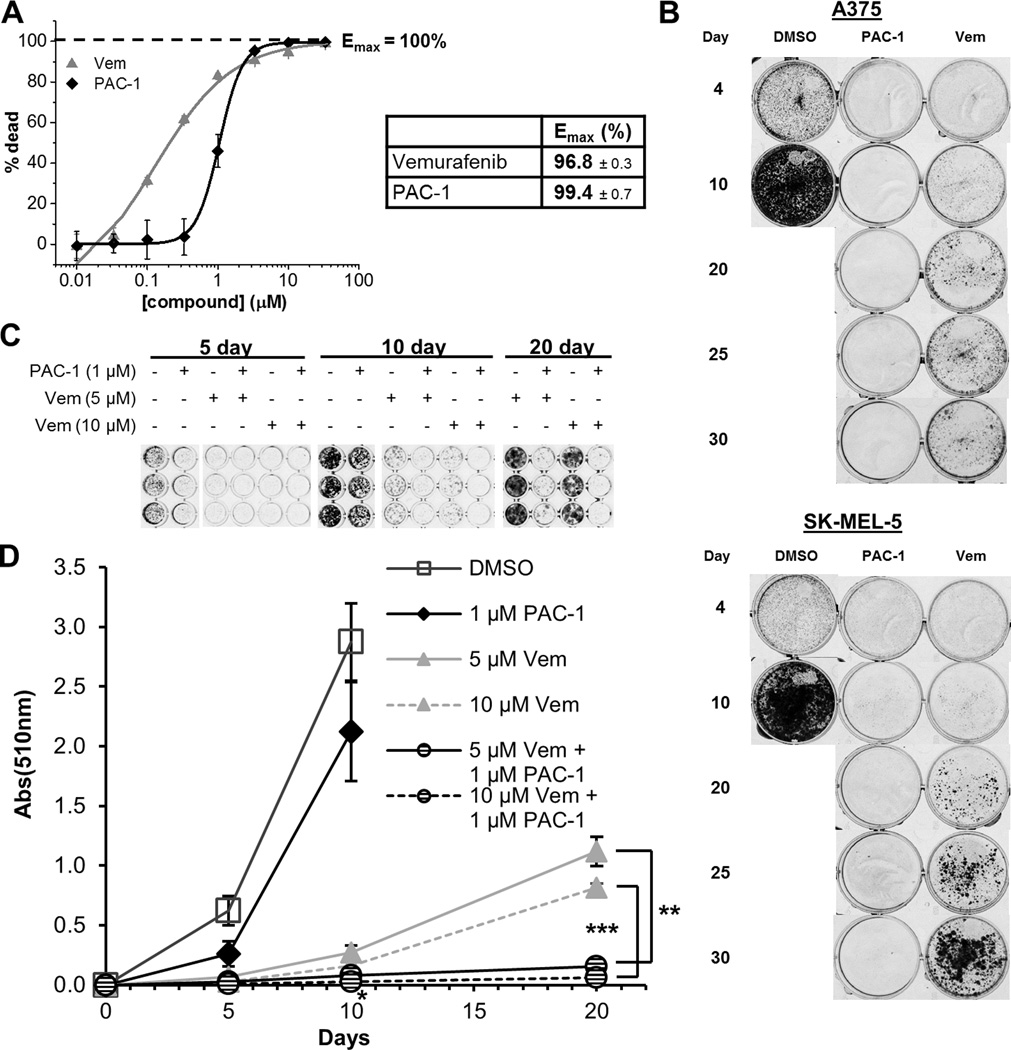
Figure 5.
Low concentrations of PAC-1 (1 µM) significantly delay cell regrowth in combination with vemurafenib in long-term cell culture experiments. (A) Comparison of Emax values in A375 cells treated with vemurafenib and PAC-1. (B) A375 and SK-MEL-5 cells treated with PAC-1 (4 µM) or vemurafenib (10 µM) for a duration of 30 days. (C) A375 cells were treated with PAC-1 (1 µM), vemurafenib (5 µM or 10 µM), or the combination. After 5, 10 or 20 days, the wells were fixed with 10% trichloroacetic acid, stained with 0.5% sulforhodamine B (SRB) dye, and imaged with BioRad GelDoc RX. Day 20 images of control and PAC-1 samples are not shown because the cells were unviable due to overcrowding. (D) Quantification of (C) where the SRB dye is dissolved in 10 mM Tris base at pH 10.4, and the absorbance read at 510 nm. Corrected absorbance at 510 nm was plotted against the days of continuous treatment by normalizing against absorbance on Day 0 before the start of treatment. Values are reported as mean ± SEM of at least three experiments. T-test performed between wells treated with vemurafenib only versus vemurafenib and PAC-1 (1 µM). On day 10, only the wells treated with vemurafenib (10 µM) and PAC-1 (1 µM) is significantly different from vemurafenib (10 µM) only (p=0.049) treatment. On day 20, wells treated with vemurafenib (5 or 10 µM) and PAC-1 (1 µM) are significantly different from vemurafenib (5 or 10 µM), as indicated. (* p<0.05, ** p<0.01, *** p<0.001)

