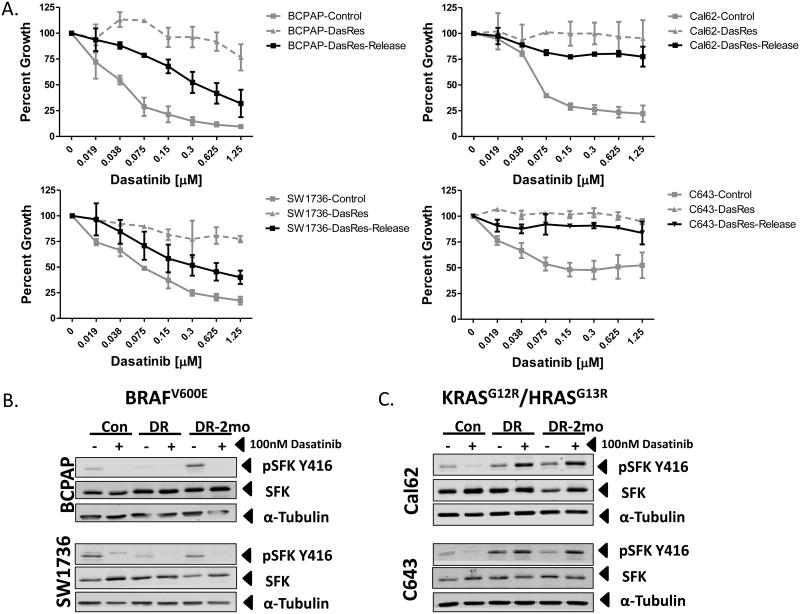
Figure 2.
Analysis of Src inhibition in control versus dasatinib-resistant cell lines. A.) SRB growth analysis of the BCPAP, SW1736, C643, and Cal62 dasatinib-resistant cells released from dasatinib for 2 months (DasRes-Release) in response to indicated concentrations of dasatinib (μM) over 72 hours of treatment. DasRes-Release growth curve is overlaid onto the growth curves for both the control and dasatinib resistant cell lines from figure 1A. B & C.) Whole cell lysates were analyzed by Western blot analysis on the BRAF-mutant (panel B) BCPAP and SW1736 and the RAS-mutant (panel C) Cal62 and C643 control (Con), Dasatinib-Resistant (DR), and Dasatinib-Resistant released from dasatinib for 2 months (DR-2mo), which were treated with either DMSO or 100nM dasatinib for 24 hours. Proteins were detected by probing with antibodies against phospho-Src Family Kinase (SFK) Y416, SFK, and α-tubulin.

