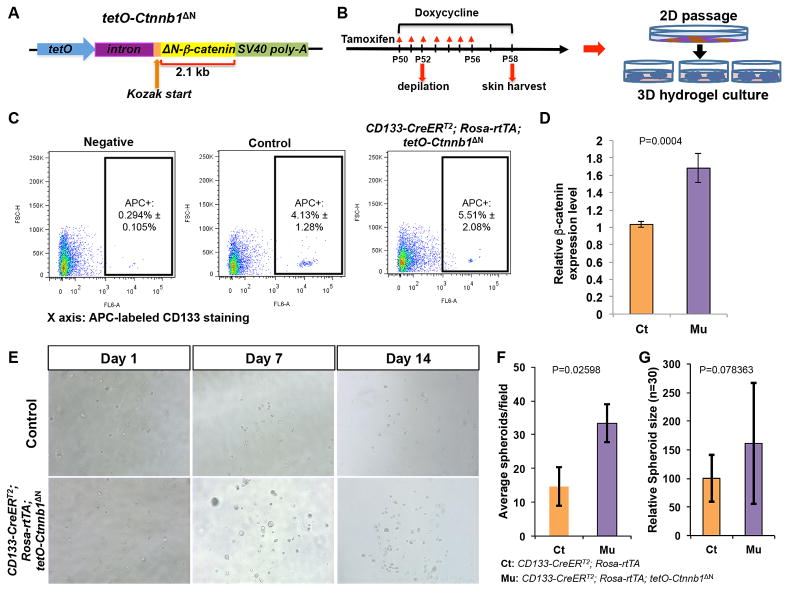
Figure 1. Generation and expansion of ΔN-β-catenin-expressing CD133+ DP cells in in vitro hydrogel culture.
A. Overview of tetO-Ctnnb1ΔN transgenic construct. B. Scheme of mouse induction, skin biology, isolation of CD133+ DP cells and hydrogel culture. C. Representative flow cytometry plots showing a unique CD133+ DP cell population labeled by an APC-conjugate anti-CD133 antibody (n=6). D. Comparison of β-catenin expression between CD133+ DP cells isolated from CD133-CreERT2; Rosa-rtTA; tetO-Ctnnb1ΔN mice and control littermates of genotype Rosa-rtTA; tetO-Ctnnb1ΔN or CD133-CreERT2; Rosa-rtTA by qPCR (n=6). E. Representative pictures showing spheroids in hydrogel at day 1, 7 and 14. Upper panels: control CD133+ DP cells; lower panels: ΔN-β-catenin-expressing CD133+ DP cells from CD133-CreERT2; Rosa-rtTA; tetO-Ctnnb1ΔN mice (n=6). F. Comparison of numbers of spheroids formed by ΔN-β-catenin-expressing and control CD133+ DP cells counted in each field under an inverted microscope (10x). At least 5 random fields were picked to count for each well (n=3). G. Sizes of spheroids formed by CD133+ DP cells in hydrogel were measured using ImageJ. At least 30 spheroids formed by control or β-catenin-expressing CD133+ DP cells were measured and averaged. Relative size difference was calculated by setting control spheroid size to 1.

