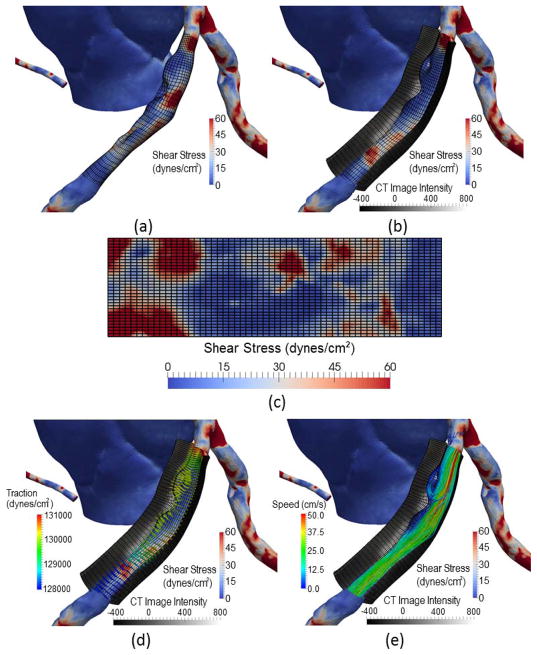
Fig. 13.
Visualization of simulated shear stress with the image features on the wall: (a) The distribution of shear stress with a quadrilateral grid with circumferential and longitudinal directions; (b) Image intensities in the arterial wall on a fan-shaped partial shell by sampling in radial directions; (c) The flattening of shear distribution on a 2D plane; (d) the total traction of the blood flow on the vessel wall as glyph vectors; (e) The streamlined blood flow patterns in the lumen.

