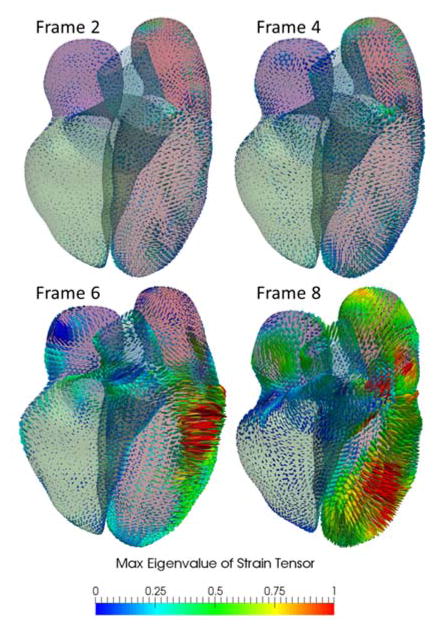
Fig. 9.
Visualization of heart motion and deformation on 3D myocardial surface. The Green-Lagrange strain tensor is calculated for all ten frames from 4D CT data, from which the geometry in the first frame is used as the reference configuration. The color-coded max eigenvalue of the strain tensor were shown in four sample frames from an animation sequence.

