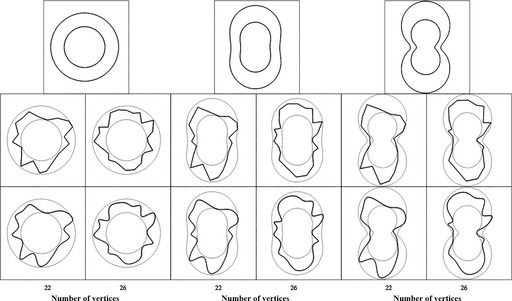
Figure 3.

Experiment 1: Illustration of the stimuli. The examples at the top are the underlying functions. The small one has a value of b = 75 pixels, and for the large one, b = 125. From left to right, the value of a was 0%, 70%, and 90% of b. The relative difference between a and b changes a circle into a peanut shape. These basic functions were not presented to the observers. Instead, shapes were generated by selecting N vertices between the small and the large versions (i.e., with a random value of b between the two extremes). These vertices produced polygons like those shown in the second row. The third row shows the polygons after a cubic spline fit. On each trial, the stimulus presented was novel.
