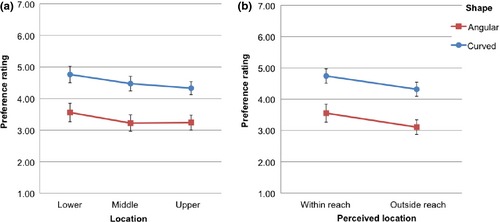
Figure 7.

Results of Experiment 2. (a) Participants' preference rating as a function of Location (lower vs. middle vs. upper part of the picture) and Shape (angular vs. curved; separate lines). (b) Participants' preference rating as a function of Perceived location (within reach vs. outside reach) and Shape (angular vs. curved; separate lines). Error bars are SE of the mean.
