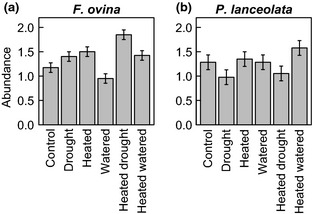
Figure 2.

Species‐level abundance of F. ovina and P. lanceolata within simulated climate change treatments at BCCIL (data from Fridley et al., 2011). Abundance was measured as ordinal vegetation cover class (0 = 0–4%; 1 = 5–24%; 2 = 25–49%; 3 = 50–74%; 4 = 75% +) within 10 × 10 cm permanent quadrats located within each 3 × 3 m grassland plot (eight quadrats per plot, five plots per treatment). Error bars show one standard error of the mean.
