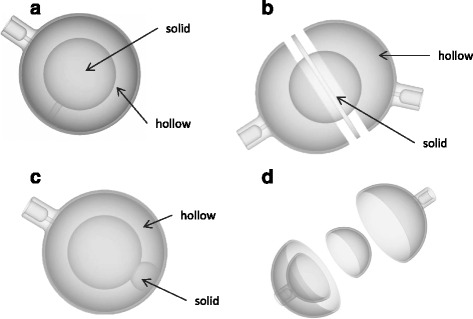
Fig. 5.

Schematic illustrations of lesion designs, to represent the deposition in the neovascular rim (a), feeding through different arterial networks (b), region of tumour where microspheres are not deposited (c) and inhomogeneous deposition at different concentrations (d)
