
. 2016 Jul 22;3(3):e33. doi: 10.2196/mental.5457
©Pia Kvillemo, Yvonne Brandberg, Richard Bränström. Originally published in JMIR Mental Health (http://mental.jmir.org), 22.07.2016.
This is an open-access article distributed under the terms of the Creative Commons Attribution License (http://creativecommons.org/licenses/by/2.0/), which permits unrestricted use, distribution, and reproduction in any medium, provided the original work, first published in JMIR Mental Health, is properly cited. The complete bibliographic information, a link to the original publication on http://mental.jmir.org/, as well as this copyright and license information must be included.
Figure 1.
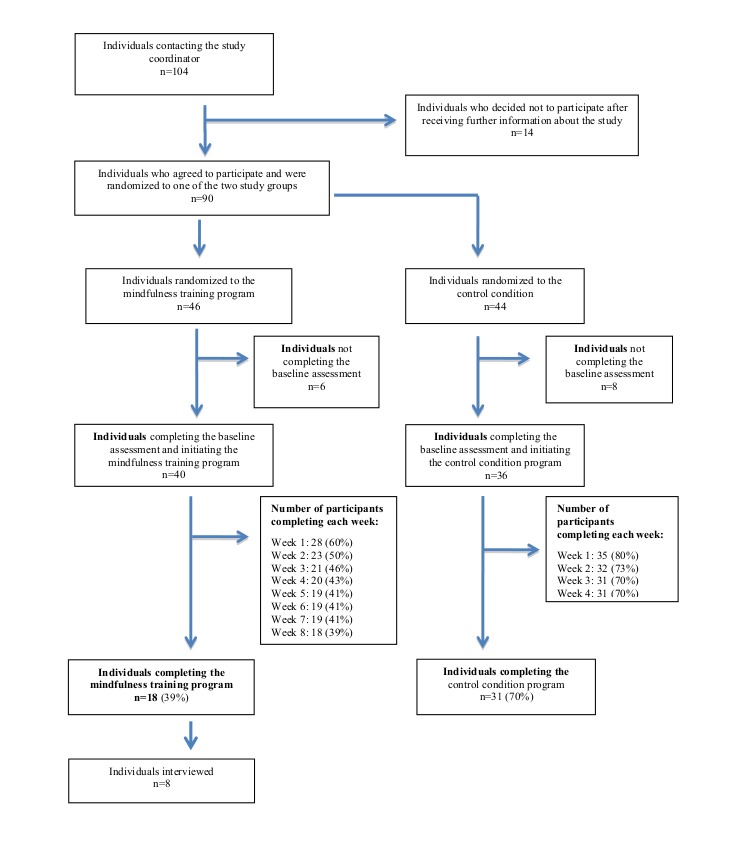
Flowchart showing enrollment and number of participants at each phase of the study.