
Fig. 2.
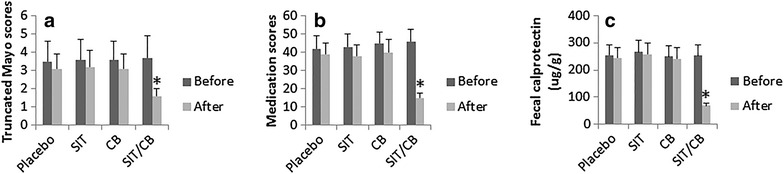
Clinical outcomes of the therapy. The bars indicate the outcomes of the therapy, including truncated Mayo scores (a), medication scores (b) and the levels of fecal calprotectin (c), which were recorded before and after completion of the therapy. *p < 0.01, compared with the placebo group. The patient numbers are the same as Fig. 1