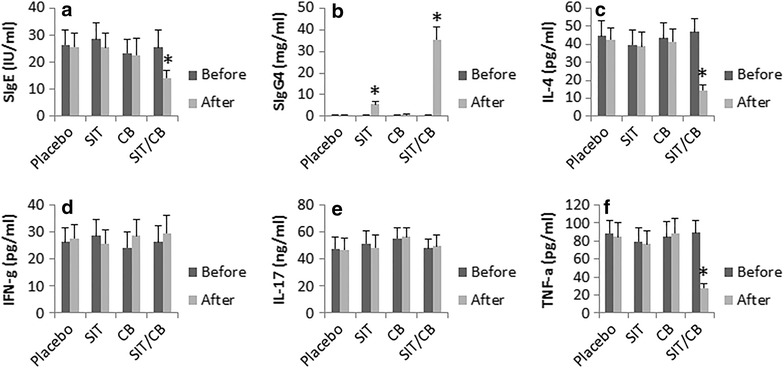
Fig. 3.

Effect of the therapy on serum IgE, IgG4 and CD4+ T cell cytokines. Peripheral blood samples were collected from each patient before and after the therapy. The sera were analyzed by ELISA. The bars indicate the serum levels of SIgE (a), SIgG4 (b), IL-4 (c), IFN-g (d), IL-17 (e) and TNF-alpha (f). The data are presented as mean ± SD. *p < 0.01, compared to the “before” values
