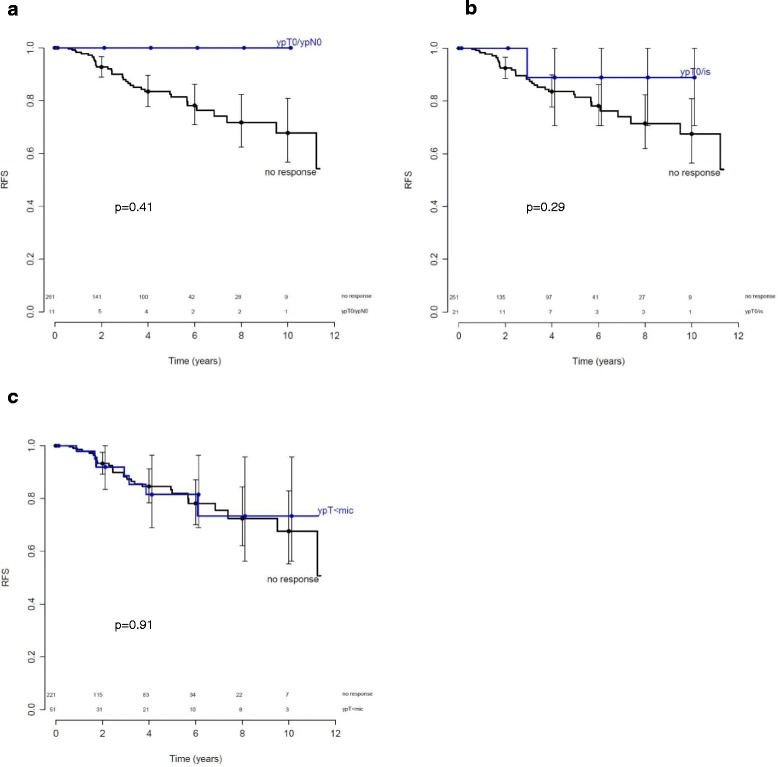
Fig. 2.

Kaplan-Meier curves for recurrence-free survival (RFS) in relation to pathologic response after neoadjuvant chemotherapy in patients with estrogen-receptor-positive tumors. The solid line indicates patients with no response. Numbers of patients at risk for each group are shown above the x-axis. a Blue line indicates no residual invasive tumor in the breast and axilla (ypT0N0) (p = 0.41); b blue line indicates no residual invasive tumor in the breast (ypT0/is) (p = 0.29); c blue line indicates only a small number of scattered tumor cells in the breast (ypT < mic, i.e., a near-complete response) (p = 0.91)
