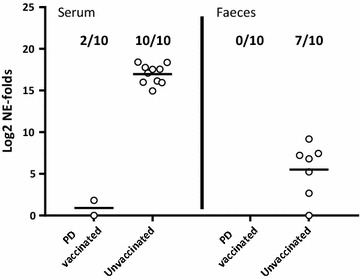
Figure 4.

Relative quantification of SAV in serum and faeces from i.m. challenged PD vaccinated or unvaccinated fish. Log2 of fold changed normalized expression (NE) values of SAV detected by qRT-PCR in faeces and serum from AQUAVAC® PD7 vaccinated and unvaccinated fish from tank 5. SAV nsP1 assay was normalized against the exogenous spike EIV assay (n = 10 per group). NE values are calibrated against the lowest NE value obtained from each tissue during the experiment and Log2 transformed. Prevalence of positive samples in each group is shown in fractions. Median values are shown by horizontal lines. Faeces and serum samples were collected 10 days post i.m. challenge.
